Analytics and attribution
Advertising analytics across every channel, without spreadsheets
Data from your ad accounts and analytics tools lands in one place. Palitra credits every channel, not just paid ones, and shows ROAS and ACoS down to a single product.
The routine it takes over
Before
Exporting every ad account and stitching it together in Excel
Working out which channel actually drives sales meant exporting each ad account and analytics tool, merging it all in a spreadsheet and arguing about the attribution model.
After
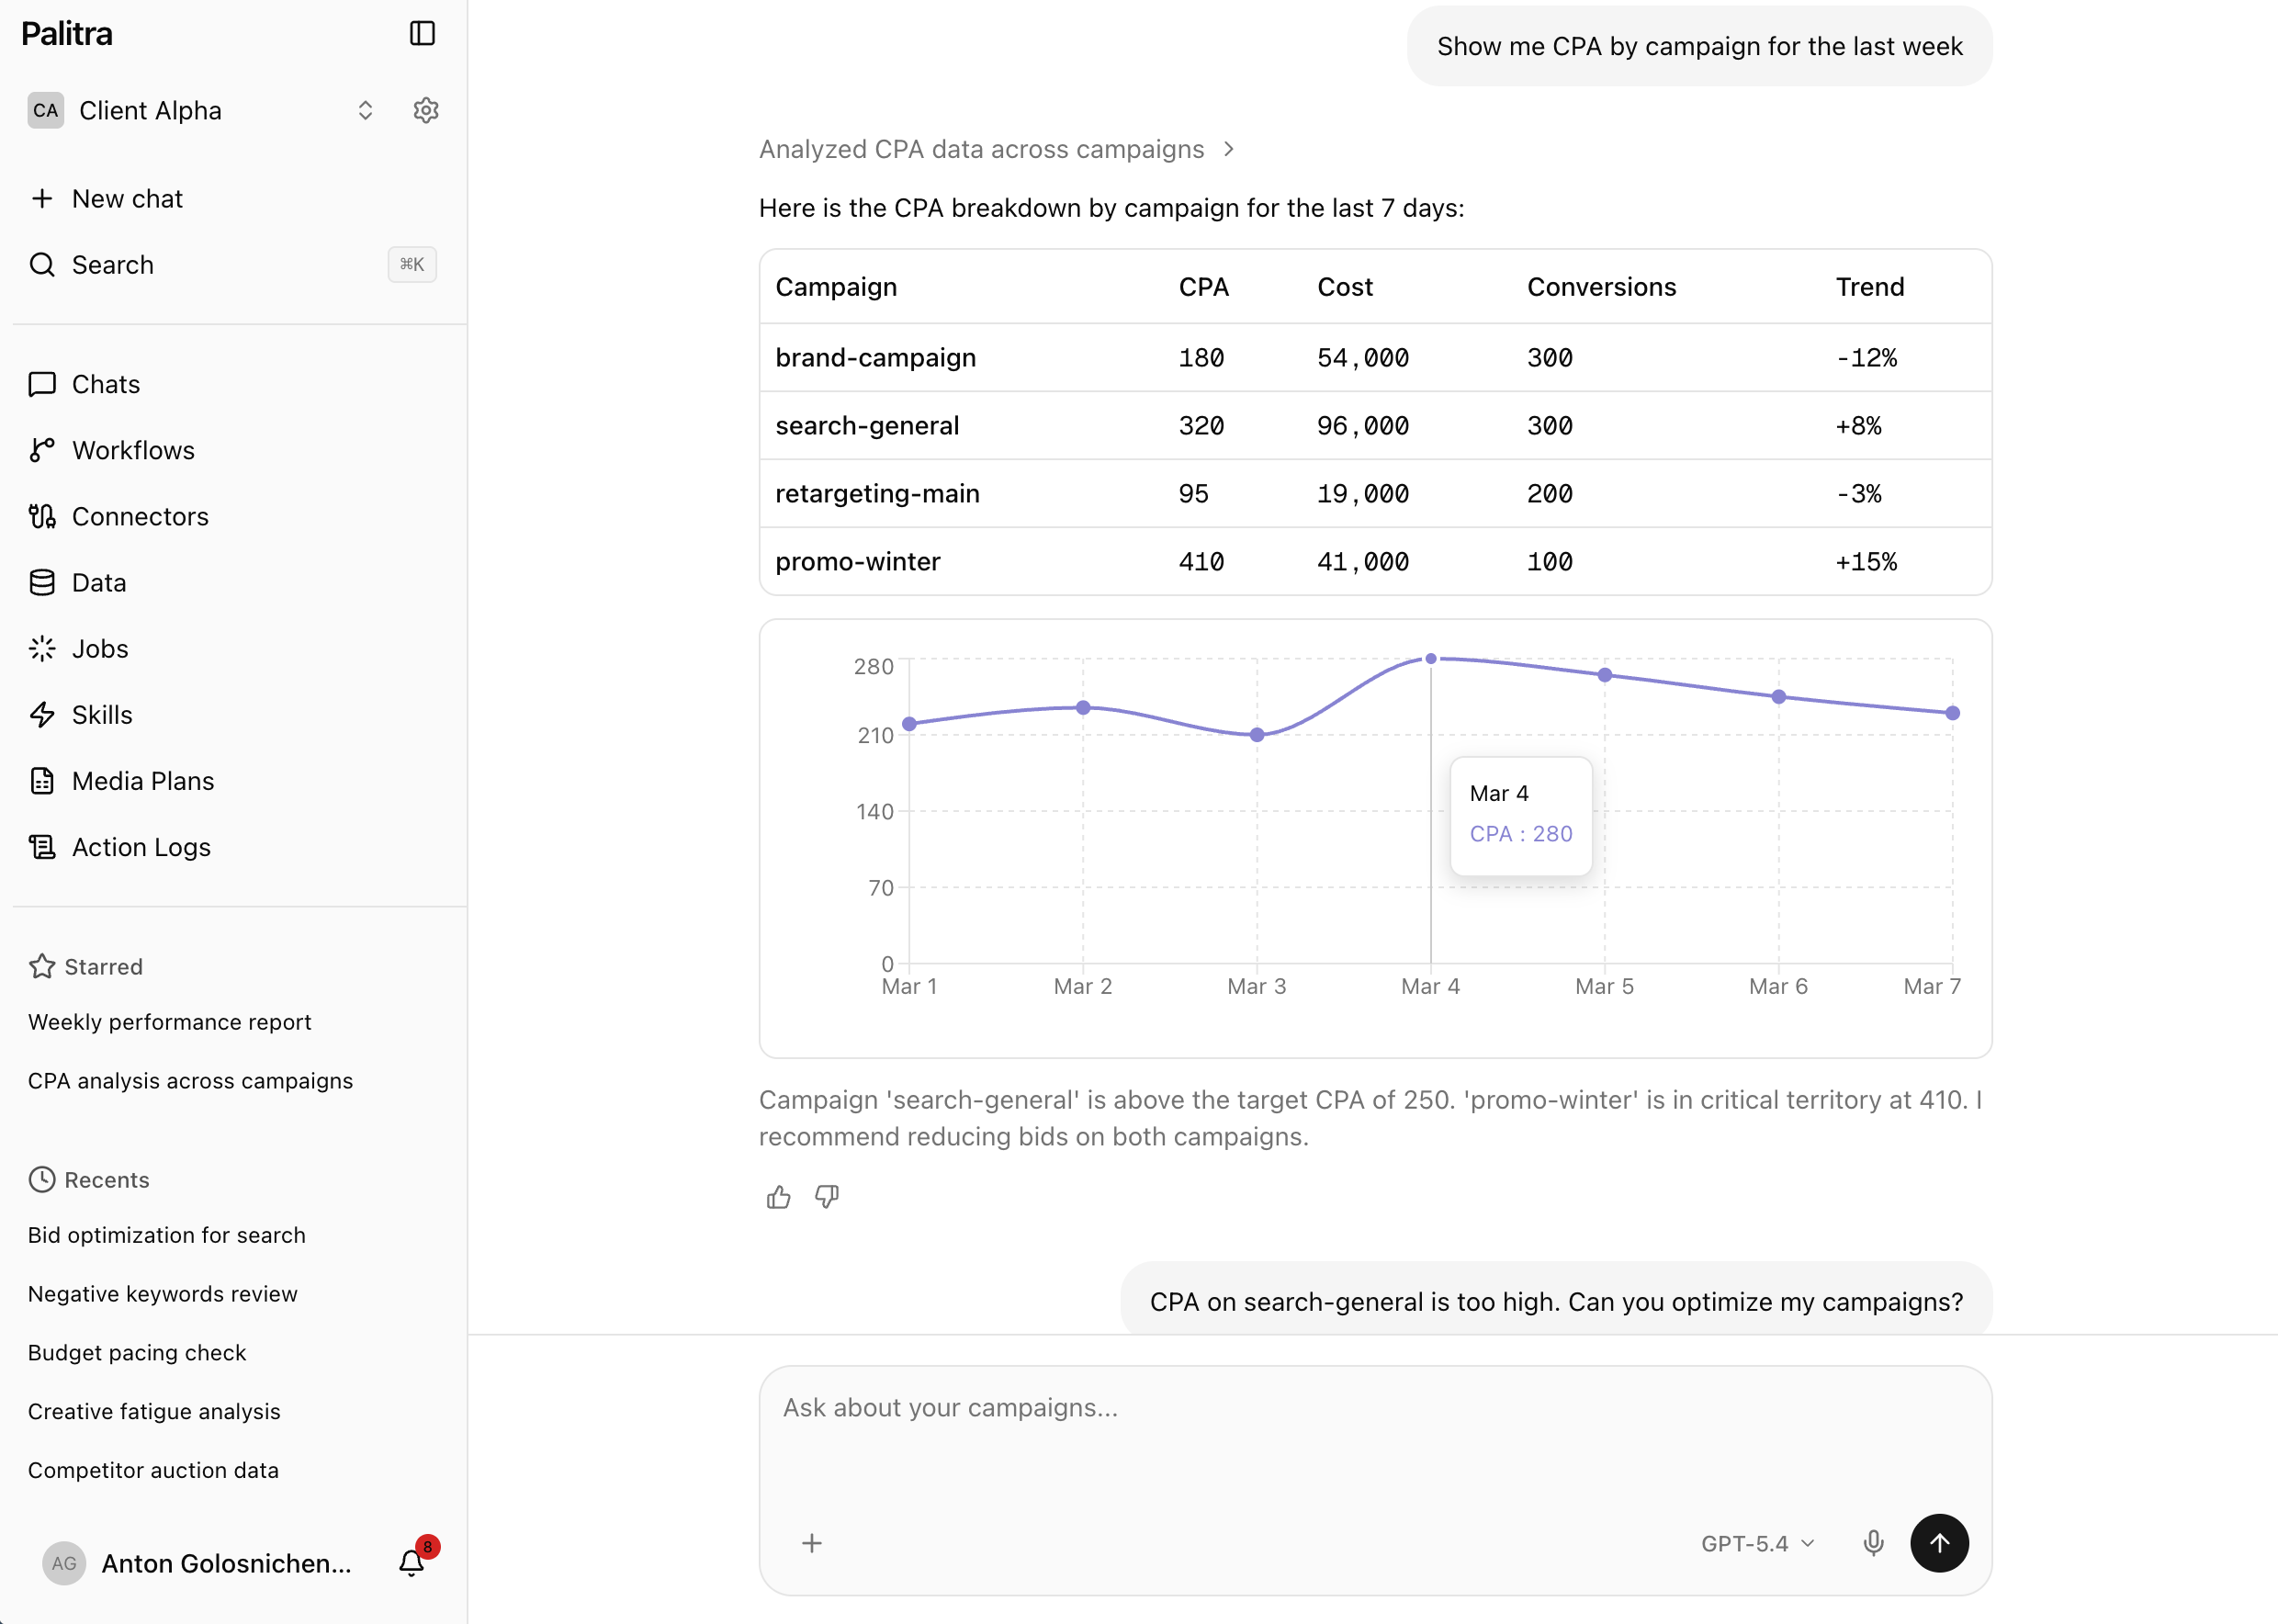
An answer with a chart and a table, right in chat
The data is already joined, and the answer comes back in chat with a chart and a table.
What it does
8 attribution models
Last Click, First Click, Linear, Time Decay, Position Based, Markov, Shapley and Data-Driven ML. Credit goes to every channel, not only paid.
Down to the product
ROAS, ACoS, GMV, AOV and CPA by channel, campaign and individual product.
Partners and coupons
Sales from partner links and coupon codes are attributed alongside your ad channels.
Scheduled anomaly detection
Palitra checks your metrics on a schedule and flags sudden swings in spend, CPA or conversion rate.
Forecasts and unit economics
Performance forecasts, CAC, LTV and payback period, plus pacing against your media plan.
MMM and complex queries
Marketing mix modeling is available on Scale and Enterprise. Complex queries over aggregated data hold up at agency scale, across dozens of clients.
What it looks like
You: How much revenue did search ads really drive in September if we don't use last click?
Palitra: Last Click gives search ads 41% of revenue; Shapley gives them 33%. Some of those sales were credited to search instead of email and retargeting, which reached the customer earlier. Under Shapley, search ACoS is 14% rather than 11%. Want the breakdown by product?
You: Yes, the ten products with the worst ACoS.
Palitra: Here's the table. Coffee machines are the weakest: 27% ACoS against a 14% average, mostly due to expensive clicks in the shopping campaign. Shall I prepare bid changes?
Available on
- Starter— included
- Pro— included
- Scale— included
- Enterprise— included
Related features
Data and tracking
Leads and sales next to your ad spend: a cookieless pixel, link tagging, webhooks, an API and CSV uploads.
AI agent
No more exporting stats and stitching spreadsheets together: ask in plain words and get an answer with a chart.
Skills
Ready-made playbooks for everyday ad tasks plus your own methods, each one a single /command away.
FAQ
Didn't find your answer? Get in touch and we'll walk you through it in a demo.